Battery Discharge Profile
Earlier, on the PiWars Discord, we were having a spirited discussion about the discharge profile of lithium batteries, disagreeing about the relationship between cell voltage and remaining charge level. I’ve never actually checked this for myself before, so I thought I’d run a little experiment to see.
When fully charged, a lithium polymer (LiPo) cell should be at 4.2 Volts. The “nominal” voltage for a LiPo cell is 3.7 V, and figures for the “minimum” recommended discharge level vary - but quoted figures range from 2.75 V to 3.0 - 3.3 V. As we’ll see later on, towards the tail end of the discharge curve the voltage of the cell drops very steeply, meaning that the precise “cut off” voltage doesn’t matter so much from the point of view of using the maximum amount of energy out of your battery.
There’s various other sites quoting a variety of different results, but I wanted to collect my own data, mostly to satisfy my curiosity, and so that I could control the experiment parameters. There is a general trend though
- the voltage drops relatively quickly at the beginning of the discharge, and very quickly at the end, with a “flatter” middle section.
Expermiental Method
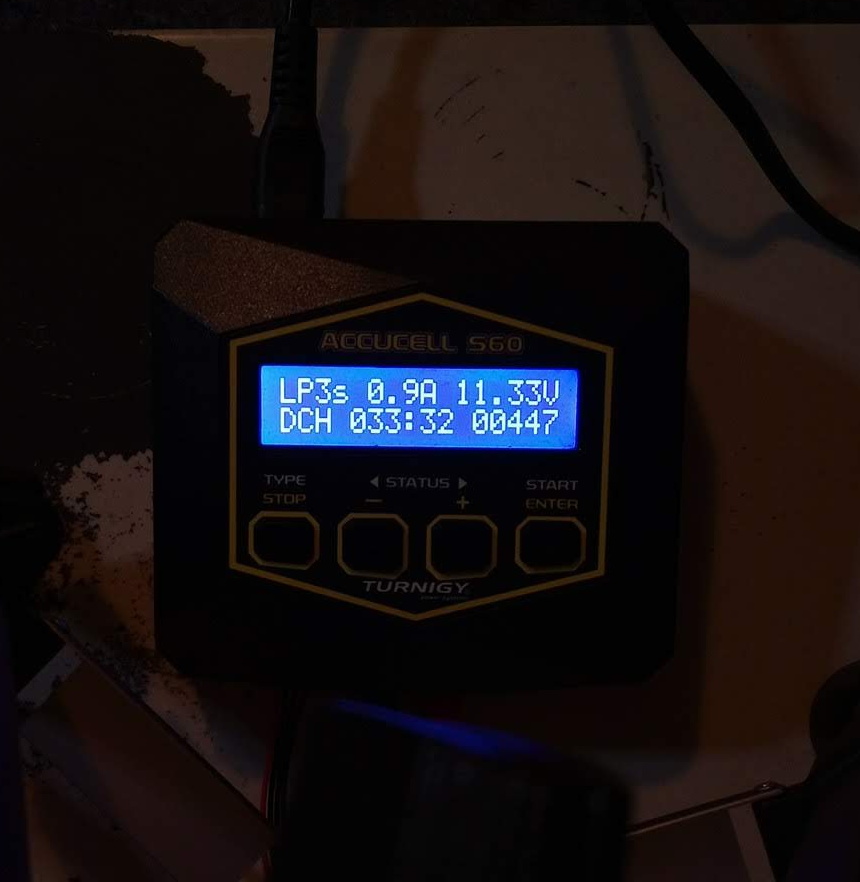
To collect the data, I hooked up a fully-charged 3S 1000 mAh, 20-30C Turnigy battery1 to my Turnigy Accucel S60 charger. The charger has a mode where it can discharge a battery with a fixed maximum current, stopping once it reaches some minimum voltage. During the discharge cycle, the screen shows the overall pack voltage, the elapsed time, the number of mAh and the instantaneous current.
The charger does have a USB port, which should apparently be able to give access to control and monitoring - but I left sorting that out to another day. Instead, I just set up a phone with the Open Camera app, pointed it at the charger’s screen, and told it to take a picture every 60 seconds. Then, I copied the values from all the pictures into a spreadsheet by hand (tedious but manageable - about 70 images).
I set the discharge current to 1 A, which corresponds to 1C for this pack. Keeping the discharge current low makes the experiment more representative of the kind of load the battery would undergo in a small rover, and should also keep the effects of voltage sag to a minimum (as the battery is running at 5% of its rated discharge rate).
For whatever reason, the actual discharge current shown by the charger was less than 1 A for the duration of the test. I don’t know exactly what the “variable load” mechanism inside the charger is, but shouldn’t matter too much, as we can use the real “mAh” value to determine an average current for each minute.
Results
I’ve collected the results in this spreadsheet. The right-hand section is the raw data, transcribed from the photos, and the left-hand section is “derived” data, in a more useful form.
Given that I only have “snapshots”, what we have is a piecewise-linear approximation of the real discharge profile. With the 1 minute sample time, it’s probably close enough to assume that the “real” profile is linear between two adjacent sample points.
The dt column is the number of seconds between points - as shown by the timer on the charger’s screen. This isn’t exactly 60 seconds, as the camera app doesn’t account for the time taken to actually capture the picture. By using the time shown by the charger, I can be sure that my “derived” numbers are the same as the internal calculations done by the charger.
The Average Voltage column is the average pack voltage for that segment:
(start + end) / 2. The “Cell Voltage” column is that number divided by
three. This assumes that all three cells in the pack are at the same voltage,
which should be true for a well-balanced pack.
Average Current is derived from the mAh readings on the charger, divided by the time difference between the sample points to give an average Ampere value for the segment.
Joules is given by voltage * current * time - this is an approximation,
assuming that the voltage and current are the same for the whole segment. We know
this isn’t true, but by using the average voltage and current values, it should
be very close (assuming the segments are linear).
The Cum. Energy column gives the total number of joules up until that point, and the Percentage Energy Remaining is what percentage of the total measured energy remains at that point. That percentage is based on an assumption that the battery was completely empty at the point where the charger cut-off. The cut-off voltage was 9.68 Volts, (~3.28 V/cell), which is close to the quoted minimums above. The charger thinks that 924 mAh had passed at that point - which is 92.4% of the battery’s quoted capacity. So, the “Energy Remaining” numbers are likely a little pessimistic, as it seems that there was still some juice left in the pack at the cut-off point. The battery is nearly new, so I’d expect it to still have a good deal of its original capacity.
Here’s the main data of interest, showing how the cell voltage changes with time, and how that corresponds to energy remaining in the pack:
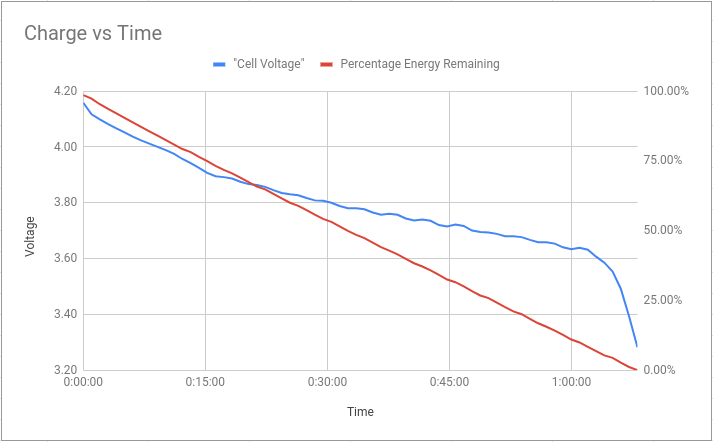
We can see the characteristic “steep, shallow, very-steep” voltage curve, which is nice; and also that the energy remaining decreases linearly with time, which means the charger did a reasonable job of keeping a constant load.
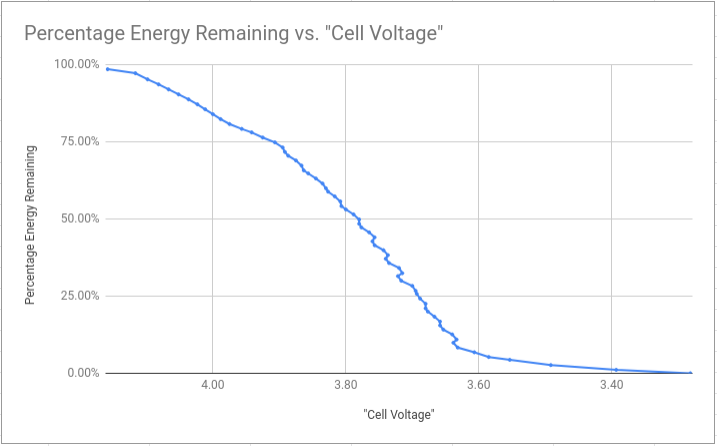
The conclusion is that the voltage “falls of a cliff” at around 3.6 V, meaning it would be very easy to over-discharge the battery if you go below that. In terms of energy, based on these numbers, if you stop at 3.6 V, you’re at somewhere around 5% charge - so you aren’t losing out on much.
It’s sometimes quoted that for maximum pack lifetime, you shouldn’t discharge below 20% charge remaining; which on this pack was around 3.68 V/cell.
Hopefully that data is useful to someone, it’s satisfied my curiosity for now.
-
3S means three cells in series, each having a 1000 mAh capacity. ↩︎